
Making complex data systems visible, understandable, and usable.
- Technically complex
- Difficult to communicate with non-technical stakeholders
- Lacking a clear, unified identity across platform, product and communication
- Platform architecture
- Product interfaces
- Communication material
- Internal culture


- Ingest — capturing large volumes of data from multiple sources
- Store — scalable, resilient data storage
- Extract — analysis through models and algorithms
- Present — visualisation through dashboards and interfaces
AQUEDUCT BIG DATA FLOW OVERVIEW
- Streams → ingestion
- Reservoirs → storage
- Currents → processing
- Surface patterns → insights
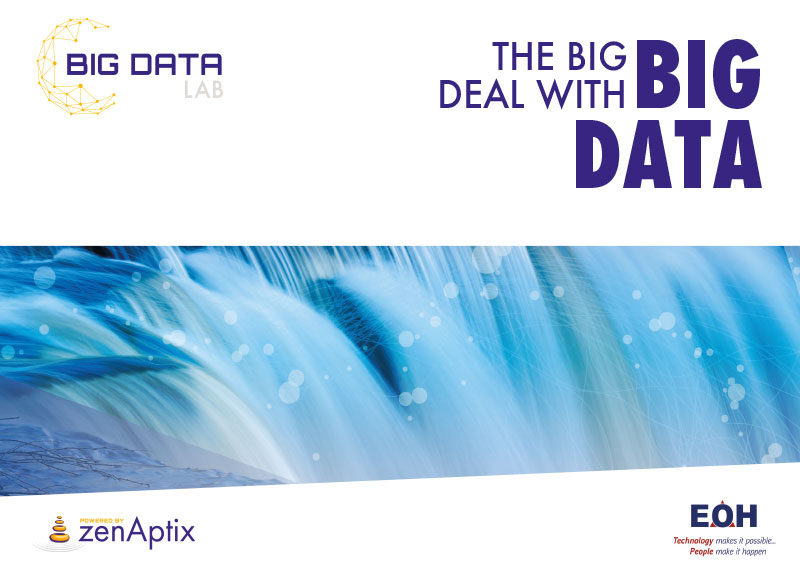
The system was applied across a wide range of outputs:
Platform & Communication
- Brochures and marketing material
- Client presentations and pitch decks
- Training materials
- System diagrams and visual frameworks

Product & Interaction
- UI/UX design for Splendi (credit reporting app for XDS)
- Animation explaining the Aqueduct platform and data flow
- Animated use cases demonstrating real-world applications
- Visualisation of federated data systems and data monetisation
AQUEDUCT USE CASE #1
AQUEDUCT USE CASE #2
SPLENDI PRODUCT PARTNER ANIMATION
Brand & Environment
- zenAptix brand identity
- Aqueduct and component logos
- Unified visual system across open-source tools and interfaces
- Website design aligned to the platform’s visual language
- Office interior design, including murals and environmental graphics
- Staff photography styled to reflect the data flow concept
- Internal brand applications, such as staff apparel
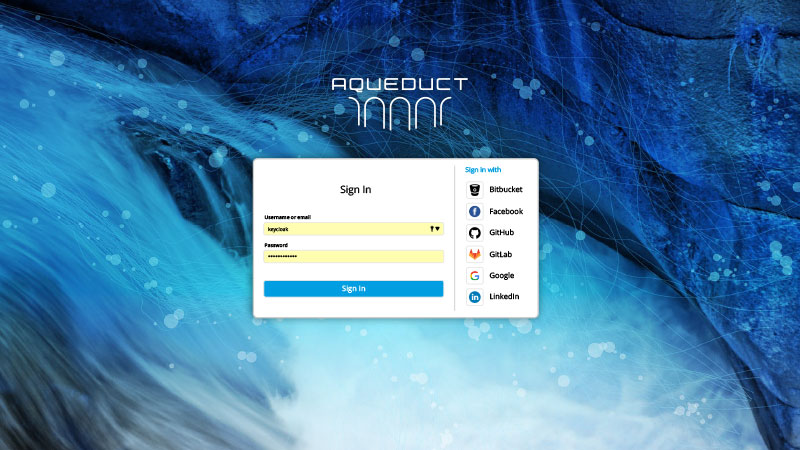
Aqueduct Login Screen
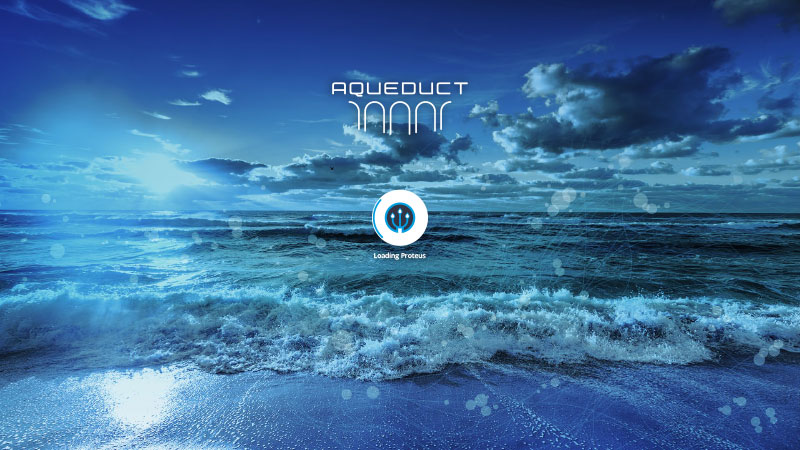

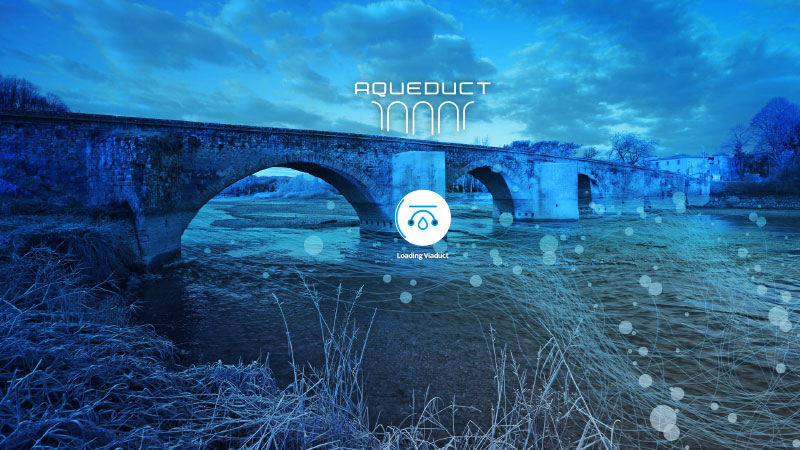

- A core animation explaining how the Aqueduct platform works
- A second animation demonstrating federated data systems and monetisation
- A product animation for Splendi, designed to engage potential partners
- These transformed abstract data processes into clear, narrative-driven experiences.
AQUEDUCT TECHNICAL OVERVIEW
- Led the overall creative direction across brand, platform and product
- Translated complex data architecture into a clear conceptual system
- Developed the visual language for data flow and system behaviour
- Designed communication, marketing and training material
- Led naming, branding and UI/UX for Splendi
- Created animations and visual narratives for platform understanding
- Applied the system across digital, physical and environmental touchpoints
- Worked closely with technical teams to align design with system functionality
- A unified brand and platform identity across zenAptix, Aqueduct and EOH Big Data Lab
- Simplified communication of complex data systems
- Improved accessibility for both technical and non-technical audiences
- A scalable visual system applied across products, platforms and environments